Ghana’s mobile money market crossed a symbolic threshold in August 2026. According to the Bank of Ghana, 1.046 billion transactions were processed during the month, with a total value of GH¢518.8 billion.
A year earlier, the country recorded 830.7 million transactions worth GH¢354.1 billion. That represents growth of 26% in volume and 46.5% in value. Over the same period, active accounts increased by only 5.4%, from 25.1 million to 26.4 million.
The gap tells a more useful story than the record alone. Activity is growing much faster than the active base. Each active account is therefore generating more movements or higher-value transactions. Yet the aggregate data do not reveal how much of that growth comes from household purchases, merchant payments, transfers, agent liquidity management or corporate flows.
One billion transactions do not mean one billion users
The Bank of Ghana counted 85.8 million registered accounts in August, compared with 26.4 million active accounts. The apparent activity ratio is therefore close to 31%. This is not a financial inclusion rate: one person may hold several accounts, and an account is considered active when it has conducted at least one transaction during the previous 90 days.
The number of transactions is not the number of distinct economic payments either. One movement of money may involve several steps: wallet funding, a transfer, a payment, agent liquidity redistribution and then cash-out. Adding these operations measures system load and usage, but not the number of purchases or unique people served.
This distinction matters when comparing countries, providers or years. Two markets may report similar transaction values while supporting very different activities.
The implied average conceals the structure of flows
Dividing total value by transaction volume produces an implied average of approximately GH¢496 per transaction in August 2026, up from GH¢426 a year earlier. The ratio increased by roughly 16%. It would nevertheless be misleading to describe it as the amount paid by an average customer.
The Bank of Ghana’s 2025 annual report explains why. Agent-to-agent transfers alone accounted for 41% of mobile money value, up from 37% in 2024. These flows mainly redistribute liquidity and settle positions within the agent network. They can carry high amounts without representing final consumption.
Third-party transfers accounted for 14.9% of value, while cash-in and cash-out together represented 16.1%. Person-to-person transfers accounted for only 5.6%, and merchant-to-agent flows for 1%.
The picture changes when transaction frequency is considered. In 2025, third-party transfers led volumes at 20.6%, followed by person-to-person transfers at 16%, data and product purchases at 15.2%, and airtime top-ups at 15.2%. Frequent everyday transactions therefore drive volume, while movements between agents dominate value.
What the growth actually demonstrates
The August figures establish at least three facts.
First, mobile money has become mass infrastructure. Processing more than one billion transactions in a month requires substantial capacity for routing, availability, status management, reconciliation and customer support.
Second, usage intensity is increasing. Transaction volume is growing much faster than active accounts. Existing customers, agents and businesses are therefore using the system more intensively.
Third, the agent network remains central. Ghana had 593,581 active agents in August 2026, 37% more than a year earlier. The e-money float balance reached GH¢39.8 billion, compared with GH¢28.4 billion a year before.
These facts do not prove provider profitability, universal access or consistent service quality. They also say nothing about success rates, incidents, fraud, resolution times or the cost borne by customers.
The indicators still missing
To assess market maturity, volume and value should be supplemented by six measures.
- End-to-end success rate. Every initiated transaction should reconcile to a final state: credited, rejected, reversed or returned.
- Share of merchant payments. This separates everyday commercial use from transfers and liquidity movements.
- Total customer cost. Sending, withdrawal, foreign exchange and indirect charges should be measured relative to the amount transferred.
- Agent liquidity availability. A large network is only useful when customers can actually deposit or withdraw when needed.
- Fraud and error losses. They should be measured in absolute value and per million transactions.
- Incident resolution time. The speed of a normal payment is not enough if a pending transaction takes days to resolve.
These indicators would shift the focus from market size to service quality.
A useful reference for other African markets
Ghana offers an important lesson for African central banks, operators and fintechs. Publishing regular and detailed series enables a more precise analysis of the market. Total value remains useful for measuring the system’s economic importance. It becomes far more informative when broken down by transaction type, active base, agent network and outstanding e-money.
For WAEMU, CEMAC and other markets developing interoperability, this distinction should be built into measurement from the start. Customer payments, merchant collections, bank-to-wallet movements, cross-border transactions and agent liquidity flows should be reported separately.
Crossing one billion transactions confirms that Ghanaian mobile money has changed scale. The next challenge is to demonstrate what that scale produces: more reliable payments, broader access, controlled costs and measurable commercial activity.
Sources
- Bank of Ghana: FinTech and mobile money statistics through August 2026
- Bank of Ghana: Payment Systems Oversight Annual Report 2025
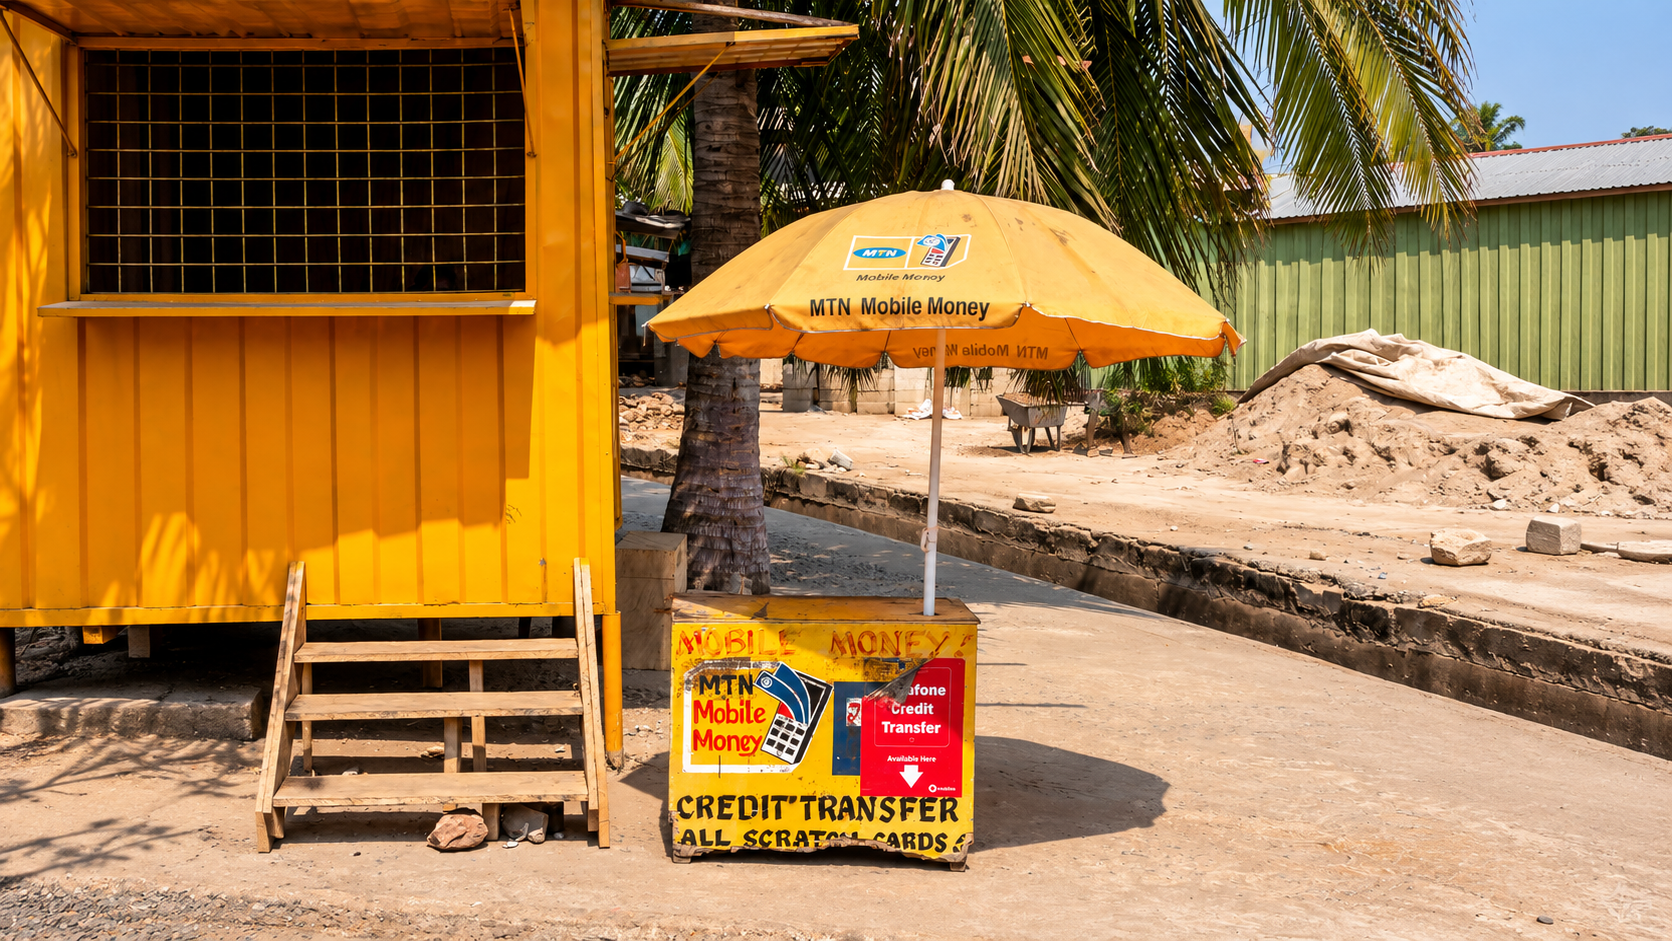
Cover credit: photograph by Matti Blume, [Wikimedia Commons](https://commons.wikimedia.org/wiki/File:MTN_MoMo_stand,_Korle-Klottey_(P1090857).jpg), licensed under [CC BY-SA 4.0](https://creativecommons.org/licenses/by-sa/4.0/). Image adapted to a horizontal format.